
Oceanic and coastal water temperatures highest recorded
10 Jul 2024
Media release | Between 2022 and 2023, oceanic and coastal waters around Aotearoa New Zealand reached their warmest annual temperatures since the series began in 1982, according to data released by Stats NZ today.
“Measuring sea-surface temperature tells us how rapidly the ocean's uppermost productive layers are warming,” environment and agricultural statistics senior manager Stuart Jones said.
Stats NZ has updated its Sea-surface temperature: Data to 2023 and Marine primary productivity: Data to 2023 environmental indicators, using data from the National Institute of Water and Atmospheric Research (NIWA).
Since 1982, sea-surface temperatures increased on average by between 0.16 to 0.26°C per decade (equivalent to 0.63 to 1.05°C during the recorded period) across oceanic regions, with the Tasman Sea having the highest average rate.
Coastal regions warmed on average by between 0.19 to 0.34°C per decade (equivalent to 0.74 to 1.35°C during the recorded period), with East Coast South Island having the highest average rate.
Each oceanic and coastal region experienced their hottest years ever recorded in either 2022 or 2023.
“Even small rises in temperature can disrupt marine ecosystems, cause some species to relocate, and increase disease risks,” Jones said. “It also contributes to sea-level rise as the warmer water expands.”
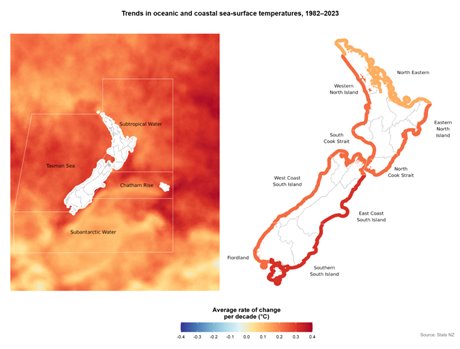
Text alternative for Trends in oceanic and coastal sea-surface temperatures, 1982–2023
The map on the left shows four oceanic regions of New Zealand: Subtropical Water, Tasman Sea, Chatham Rise, and Subantarctic Water. They are coloured to show the average rate of oceanic sea-surface temperature change per decade in degrees Celsius between 1982 and 2023. In the map on the right, the coastal areas around New Zealand are coloured to show the average rate of change. The scale for both maps ranges from a rate of change of -0.4 degrees Celsius (dark blue) to 0.4 degrees Celsius (red). Red represents positive rates of change meaning that the rate of sea-surface temperature is increasing, while at the other end of the scale dark blue represents negative rates of change meaning that the rate of sea-surface temperature is decreasing.
Marine heatwaves – prolonged periods of unusual seawater warmth – also reached new levels. The Tasman Sea spent 61 percent of the 2022 year in a marine heatwave, the highest among oceanic regions. Western North Island experienced heatwave conditions for 89 percent of the year, the highest among coastal regions.
Warming seas can influence primary production through the generation of organic matter by phytoplankton (microscopic algae), which supports the marine food chain. In the ocean surrounding New Zealand, between 1998 and 2022, marine primary productivity has tended to decrease with rising sea temperature in the warmer northern waters, while increasing with rising sea temperature in the cooler southern waters.
Stats NZ also published its River water quality – heavy metals: Data to 2022 indicator today, which reports on the concentrations of two dissolved metals in rivers and streams in predominately urban areas. Between 2013 and 2022, dissolved copper concentrations were increasing at 28 out of 50 sites, while dissolved zinc concentrations were decreasing at 36 out of 65 sites.
As part of a joint Environmental Reporting programme with partner Ministry for the Environment, Stats NZ publishes and updates environmental indicators on the pressures, state, and impacts of New Zealand’s environment including air, marine, fresh water, land, and atmosphere and climate.
print this story
New funding round opens for Auckland zero waste projects – $500k available
Fri 24 Jul 2026
Media release | Auckland Council is inviting applications for the 2026 Waste Minimisation and Innovation Fund (WMIF) with $500,000 available to support projects that reduce waste and increase recycling and reuse to help achieve Auckland’s goal of zero waste by 2040.

Turning waste into climate-resilient soils for communities
Fri 24 Jul 2026
Media release: University of Canterbury | Christchurch’s Red Zone is being used as a test bed to see whether biological wastes (biowastes) can help transform contaminated soil into climate-resilient soil.

Dry-year reliability obligation should fall on generators, not major electricity users – MEUG
Thu 23 Jul 2026
Media release | The Major Electricity Users' Group (MEUG) is urging the Government to redesign its proposed dry-year reliability obligation so responsibility for securing New Zealand's electricity supply rests with generators rather than major electricity users.

Greenpeace launches legal challenge against US$2.5bn expansion by Premier Beehive parent company JBS
Thu 23 Jul 2026
Media release | Greenpeace Netherlands has petitioned a Dutch court seeking to compel the world’s largest meat company JBS, to disclose information, in order to challenge its business policies in court. This includes its planned US$ 6 billion global expansion, of which almost half is earmarked for Nigeria.
Select committee report on resource management guts environmental protections
Wed 22 Jul 2026
Media release | Forest & Bird says the Environment Committee report on the biggest overhaul of resource management law in Aotearoa New Zealand in a generation is bad news for nature.
Open Letter: Exercise restraint on LNG import facility decision ahead of the election
Tue 21 Jul 2026
The Smart Energy Alliance respectfully urges the Government not to enter into a binding commercial agreement for a liquefied natural gas (LNG) import facility in the period immediately preceding the General Election.
Tauranga secures international funding to support rangatahi climate action
16 Jul 2026
Media release: Tauranga City Council | Tauranga has been selected as one of 300 cities worldwide to receive funding through the Bloomberg Philanthropies Youth Climate Action Fund, creating new opportunities for local rangatahi to turn their climate action ideas into reality.

University launches worldwide search for nature-focused researchers
15 Jul 2026
Media release | As governments and businesses around the world grapple with climate change and biodiversity loss, Waipapa Taumata Rau, University of Auckland is launching an international search for ten PhD researchers to help shape a more nature positive economy.

New entrant seeks to expand exploration portfolio
14 Jul 2026
Media release | Resources Minister Shane Jones has welcomed further investment interest in New Zealand's petroleum sector, with a recent new entrant seeking to expand its exploration interests in the offshore northern Taranaki Basin.

Fifth new petroleum application targets Taranaki
8 Jul 2026
Media release: New Zealand Government | An application targeting frontier deepwater in the Taranaki Basin marks the fifth permit application to prospect or explore for petroleum since the removal of the exploration ban, Resources Minister Shane Jones says.